

From February to October, I conducted a comprehensive analysis of print operations, focusing on key metrics such as print time, ink usage, and material waste. Using AI-powered text reformatting in Google Sheets, I collected and reformatted data from two different printers—the Roland digital printer and the HP flatbed printer—streamlining data processing to ensure accuracy and consistency. Leveraging Python, I performed in-depth data analysis, identifying inefficiencies and trends in ink consumption and material usage. Additionally, I utilized Tableau to visualize my findings, creating an insightful presentation that highlights opportunities for optimization. My work provided actionable insights to improve resource management, reduce waste, and enhance production efficiency within the printing process.
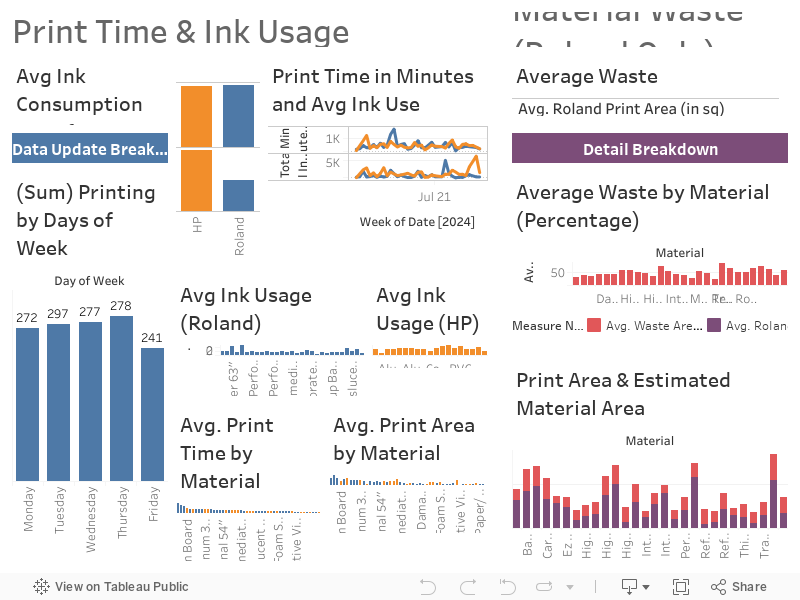

Both printers have a similar total printing time from February to October, but the Roland printer has used less ink during that period. Additionally, Roland's ink usage per square inch is nearly half that of HP’s. This could be due to two factors:
1. Roland prints contain more white space, particularly from white letters in logos, which are often cut out.
2. Roland is more efficient in its ink usage.

Most printing occurs throughout the week, with a noticeable dip on Friday. Not only does Friday have the fewest files printed, but it also accounts for the least amount of total printing time.
Print time doesn’t always correlate with the overall print size of a file. The quality of the RIP/print can have just as much impact on the bandwidth of printing jobs.
As seen in the data, perforated materials have a significantly higher print time, even though they are not among the most printed materials by area. Collecting data on these variables could help refine pricing strategies. Moreover, offering a premium option for higher-quality prints could attract more revenue.

Banners not only account for a significant portion of printing time but are also among the most efficient prints. They have some of the lowest percentages of material waste while covering the largest print areas overall.
On average, the material waste rate is 44.77%. Laminated jobs contribute significantly, with an estimated 30 inches of lead-in and lead-out material required for the laminating process. Other materials typically add around 15 inches. However, these figures are not fixed and may vary from print to print.
A trend is emerging: larger width materials tend to generate less waste compared to smaller width materials.
A lot of these materials don’t have enough data entries to provide a clear view of trends. The challenge will be to combine this data with future data collection efforts, as I plan to change how data is collected, especially when identifying material waste.
Add "LAM" to file names to identify prints that are being laminated, ensuring more accurate estimates of material usage per file.
Add "FLL" to file names to indicate that the print utilizes material on both the left and right as part of the job, making the print width the same as the material width.
Use "+" in file names to identify when multiple jobs are in one file to evaluate the effectiveness of combining files.
Extract print quality data to analyze differences between high-quality and standard-quality prints.
Keep HP and Roland printer data separate until analysis is complete. This will reduce processing time in Google Sheets, which can struggle with large datasets.

